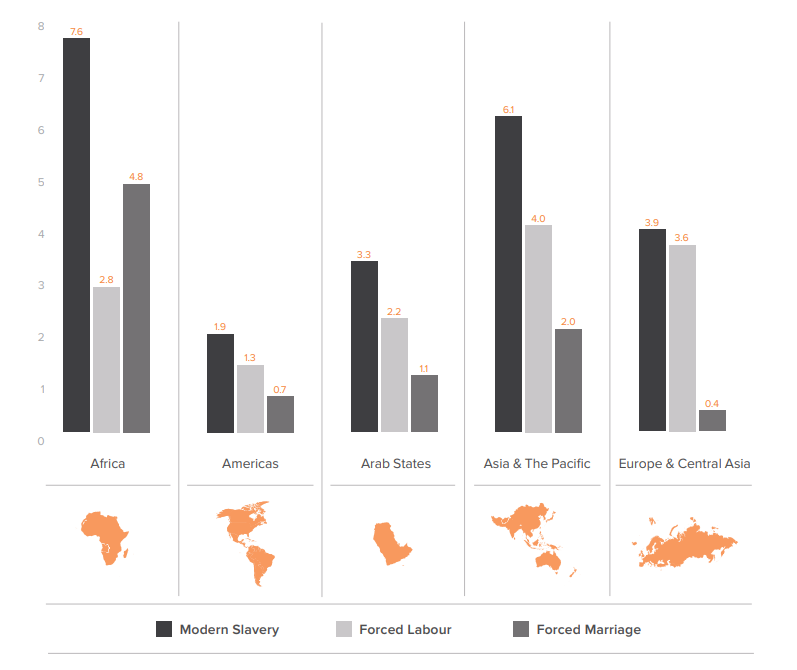
Globally, there were 5.4 victims of modern slavery for every 1,000 people in the world. Looking regionally, the prevalence of modern slavery was highest in Africa with 7.6 victims for every 1,000 people in the region. This was followed by Asia and the Pacific (6.1 victims) and Europe and Central Asia (3.9 victims). The prevalence in the Arab States and Americas was lower, at 3.3 and 1.9 victims per 1,000 people respectively (noting the caveats below regarding data limitations, particularly in the Arab States).
When we separated forced labour and forced marriage, a different regional picture emerged. For forced labour, Asia and the Pacific had the highest prevalence (4.0 victims for every 1,000 people), followed by Europe and Central Asia (3.6) and Africa (2.8). The prevalence of forced labour was lowest in the Arab States (2.2 victims) and the Americas (1.3 victims). The prevalence of forced marriage was highest in Africa (4.8 victims), followed by Asia and the Pacific region (2.0 victims), and the Arab States (1.1 victims). The prevalence was lowest in the Americas (0.7 per 1,000 people) and Europe and Central Asia (0.4 victims).
At the regional level, the impact of conflict and state-imposed forced labour remained consistent with the global findings, with the highest prevalence occurring primarily in countries with well-documented state-imposed forced labour or marked by protracted or recent conflict. The countries with highest prevalence across the regions included Eritrea, Burundi, and the Central African Republic (Africa); Venezuela, Haiti, and Dominican Republic (Americas); North Korea, Afghanistan, and Pakistan (Asia and the Pacific); Syria, Iraq, and Yemen (Arab States); and Belarus, Turkmenistan, and Macedonia (Europe and Central Asia).
Regional prevalence of modern slavery (per 1,000 population) by category
 Vulnerability across the regions
An improved understanding of the drivers of modern slavery – that is, the factors that increase vulnerability to modern slavery – is critical to the development of successful interventions. Our assessment of vulnerability is conducted at the national level and covers five dimensions: governance issues, lack of basic needs, inequality, disenfranchised groups, and effects of conflict.
A regional analysis of our vulnerability measures suggests higher risk of modern slavery in the Arab States and the Americas than is evident in the prevalence data. The Arab States had the second highest vulnerability scores across the five regions, despite having relatively low prevalence estimates.
The Africa region had the highest average vulnerability score (62 percent), followed by the Arab States (57 percent), Asia and the Pacific (46 percent), and the Americas (41 percent), while the lowest levels of vulnerability are found in Europe and Central Asia (28 percent). Looking behind the overall vulnerability scores to the dimension level, it is apparent that across the regions, vulnerability related to governance issues, lack of basic needs, and disenfranchised groups were highest in Africa, vulnerability related to inequality was highest in the Americas, and vulnerability related to conflict was highest in the Arab States.
Government responses across the regions
The Europe and Central Asia region had the strongest response to modern slavery, with countries scoring an average BB rating. Within the broader Europe and Central Asia region, European governments in particular are generally characterised by both high levels of political will and resources, and this is backed up by regional bodies that provide monitoring and oversight. The Americas had the second strongest responses to modern slavery, scoring an average B rating, reflecting improvements in both victim identification mechanisms and support services. Both Asia and the Pacific and the Arab States have a CCC rating on government responses. However, the responses themselves within these two regions were different, with some countries in the Asia and the Pacific region starting to provide safety nets and protections for people in high risk sectors or groups. The Africa region, with a CC rating, had the lowest average regional government response score, but this should not diminish important improvements made in recent years, including introduction of criminal laws and national referral mechanisms in several countries including Côte d’Ivoire and Sierra Leone. Despite this, in Africa, limited resources and ongoing conflict continued to hinder more comprehensive responses to modern slavery.
AFRICA
With 51 countries and 16 percent of the world’s population, Africa is enormously diverse in terms of history, development, people, culture, and religion.
9,240,000 - Estimated number of people in modern slavery
23% - Regional proportion of global estimate
35% - Forced labour percentage
63% - Forced marriage percentage
On any given day in 2016, an estimated 9.2 million men, women, and children were living in modern slavery in Africa. The region has the highest prevalence of modern slavery in the world with 7.6 per 1,000 people in the region.
When considering the forms of modern slavery, the rate of forced marriage (4.8 victims per 1,000 people in the region) was higher than the rate of forced labour (2.8 victims per 1,000 people in the region).
Over half of all victims of forced labour exploitation (54 percent) were held in debt bondage, with similar proportions of men and women in the region trapped through debt. An estimated 400,000 people in the region were victims of forced sexual exploitation, accounting for eight percent of all victims of forced sexual exploitation and commercial sexual exploitation of children worldwide.
Within the region, Eritrea, Burundi, and Central African Republic were the countries with the highest prevalence of modern slavery; however, Nigeria and the Democratic Republic of the Congo had the highest absolute number and accounted for over one-quarter (26.3 percent) of all victims in the region.
These regional figures, while important, should be interpreted cautiously given the gaps and limitations of data in certain countries. For example, it is not possible to survey in countries that are experiencing profound and current conflict, such as Libya, South Sudan, and parts of Nigeria. The lack of data from countries experiencing conflict means that modern slavery estimates in these countries are likely to understate the problem.
Vulnerability within Africa
Regional average vulnerability scores by dimension, Africa
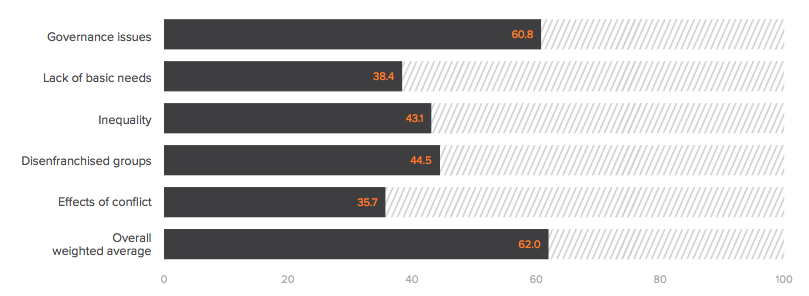 The prevalence estimates are consistent with findings from the vulnerability measures, which suggest the Africa region had the highest average vulnerability score (62 percent). The Africa region performed relatively poorly on the governance issues, lack of basic needs, and disenfranchised groups dimensions of the vulnerability model. These rankings reflect the challenges that continue to plague certain countries in this region in terms of resource allocation, effective governance, and acceptance of minority groups. The Central African Republic, South Sudan, and the Democratic Republic of Congo had the highest levels of vulnerability, while Mauritius and Tunisia had the lowest levels of vulnerability in the region.
Government responses within Africa
While the Africa region has the lowest average regional government response score, with a CC rating, there have been significant improvements in specific countries and a trend to strengthen modern slavery legislation. Six countries have passed strengthened trafficking legislation since 2016, most recently in Côte d’Ivoire and Morocco.
There are also multiple regional bodies in Africa that have been proactive in responding to modern slavery, which points to increasing opportunities to hold governments to account. Despite this, limited resources and ongoing conflict continue to hinder more comprehensive responses to modern slavery in the Africa region.
AMERICAS
With 35 countries and 13 percent of the world’s population, the Americas is home to geographically large countries such as Brazil, Argentina, Canada, and the United States and features wide socio-economic differences within each country and across the region.
1,950,000 - Estimated number of people in modern slavery
5% - Regional proportion of global estimate
66% - Forced labour percentage
34% - Forced marriage percentage
On any given day in 2016, an estimated 1.9 million men, women, and children were living in modern slavery in the Americas. This region had a prevalence of 1.9 people in modern slavery for every 1,000 people in the region.
When considering the forms of modern slavery, the rate of forced labour (1.3 victims per 1,000 people) was higher than the rate of forced marriage (0.7 victims per 1,000). A little over a third of victims of forced labour exploitation were held in debt bondage (37.9 percent), with similar proportions of men and women in the region trapped through debt.
The region also accounted for four percent of all victims of forced sexual exploitation worldwide.
Within the region, Venezuela, Haiti, and the Dominican Republic were the countries with the highest prevalence of modern slavery; however, the United States, Brazil, and Mexico had the highest absolute numbers and accounted for over half (57 percent) of the victims in the region.
These regional figures, while important, should be interpreted cautiously given the gaps and limitations of data in key regions. For example, there are no surveys conducted in North America.
Vulnerability within the Americas
Regional average vulnerability scores by dimension, Americas
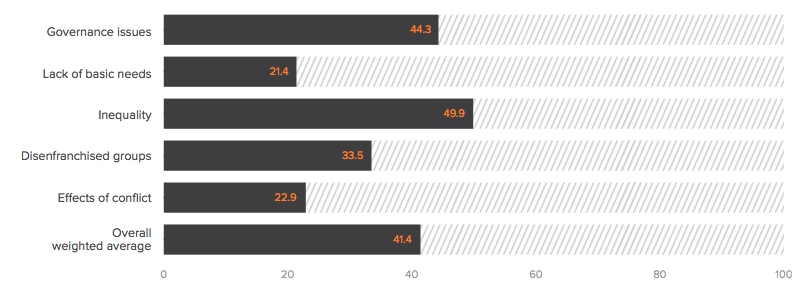 The average vulnerability score in the Americas (41 percent) suggests a higher risk of modern slavery in this region than is evident in the prevalence data. The Americas region performed relatively well on the dimensions that measure impact of conflict and acceptance of minority groups, with a better average score than other regions, but relatively poorly on the governance and the inequality dimensions, which can reflect increasing income inequality, significant problems associated with violent crime, and lower confidence in judicial systems. Across all dimensions of vulnerability, scores in the region ranged from a high of 70 percent in Haiti to a low of 10 percent in Canada.
Government responses within the Americas
Governments in the Americas have taken strong steps to respond to modern slavery, with improvements in victim identification mechanisms and support services. The Americas scores an average B rating, with countries such as Chile, Argentina, and Peru strengthening their national referral mechanisms and guidelines for identifying victims in recent years. Certain countries within the Americas, namely the US and Brazil, also lead the way globally on engaging with business. Brazil has been engaging with business to prevent trabalho escravo (slave labour) since 2005 with the launch of its National Pact for the Eradication of Slave Labour, a multi-stakeholder initiative to engage national and international companies to maintain supply chains free from slave labour.
ARAB STATES
The Arab States region covers 11 countries including Bahrain, Iraq, Jordan, Kuwait, Lebanon, Oman, Qatar, Saudi Arabia, Syria, United Arab Emirates and Yemen, and is home to two percent of the world’s population. The region is diverse, spanning the wealthier Gulf Cooperation Council (GCC countries) and countries such as Jordan, Lebanon, and Iraq, which are dealing with the impact of ongoing conflict in Syria.
520,000 - Estimated number of people in modern slavery
1% - Regional proportion of global estimate
67% - Forced labour percentage
33% - Forced marriage percentage
On any given day in 2016, an estimated 520,000 men, women, and children were living in modern slavery in the Arab States. This is a prevalence of 3.3 victims per 1,000 persons. When considering the forms of modern slavery, the largest share of those in modern slavery were victims of forced labour (2.2 victims per 1,000 people), while the rate of forced marriage was 1.1 victims per 1,000 people.
Over half of all victims of forced labour exploitation (51 percent) were held in debt bondage and this affected a greater share of female victims than male victims. The Arab States accounted for one percent of victims of forced sexual exploitation globally.
Within the region, Syria, Iraq, and Yemen had both the highest prevalence of modern slavery and the highest absolute number of victims, accounting for 76 percent of the victims in the region.
These regional figures, while important, should be interpreted cautiously given the gaps and limitations of data in this region. Only two national surveys were conducted in the Arab States region (Lebanon and Jordan), both conducted in Arabic, and none were conducted in the Gulf Cooperation Council (GCC) states, despite the incidence of forced labour reported by various sources in such sectors as domestic work and construction in the GCC countries. The regional estimates for the Arab States were therefore built mainly from respondents who were interviewed in their country of residence and reported about their forced labour situation while working in that region. Further, measurement of forced marriage among residents of countries within the region is particularly problematic where there are no surveys. Taken together, these gaps point to the likelihood of a significant underestimation of the extent of modern slavery in this region.
Similarly, as it is typically not possible to survey in countries that are experiencing profound and current conflict, such as Syria, Iraq, and Yemen, data from these states are likely to understate the problem.
Vulnerability within the Arab States
Regional average vulnerability scores by dimension, Arab States
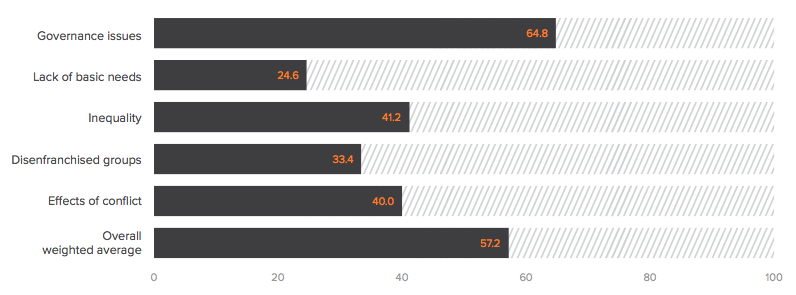 A regional analysis of our vulnerability measures suggests higher risk of modern slavery in the Arab States than is evident in the prevalence data, with the Arab States rating as the second most vulnerable region (57 percent). The Arab States region performed relatively well on the lack of basic needs dimension of the vulnerability model, but relatively poorly on the governance and effects of conflict dimensions. The regional score in the conflict dimension hides diversity within the region, with some countries such as Yemen, Syria, and Iraq scoring much higher on this dimension than other countries in the region. The regional average on measures of inequality points to slightly higher vulnerability than the global average on this dimension (41 percent cf 38 percent) and, again, there is a great deal of diversity within the region, with scores ranging from a low of 25 percent in UAE to a high of 65 percent in Iraq. Across all dimensions of vulnerability, the highest score was found in Syria (92 percent).
Government responses within the Arab States
The Arab States region scores an average CCC rating on government response. This is despite its relatively high GDP (PPP) per capita in the GCC countries. As a wealthy subregion, the GCC States average CCC rating reveals limited protections for migrant populations most vulnerable to modern slavery. Unlike Asia Pacific (also averaging CCC), the more stable governments in this region which might be expected to act, have taken very few steps to protect the rights and safety of the millions of migrant workers who make up their construction and domestic work sectors. Other countries in the region, such as Jordan and Lebanon, have put in place some protections for migrant populations, but struggle to deal with ongoing conflict in Syria and Yemen, and the flow of people fleeing these crises.
ASIA AND THE PACIFIC
With 36 countries and 56 percent of the world’s population, the Asia and the Pacific is the world’s largest region and is broadly diverse in terms of ethnicity, culture, religion, and development
24,990,000 - Estimated number of people in modern slavery
62% - Regional proportion of global estimate
66% - Forced labour percentage
34% - Forced marriage percentage
On any given day in 2016, an estimated 24.9 million men, women, and children were living in modern slavery in Asia and the Pacific. The region had the second highest prevalence of modern slavery in the world with 6.1 per 1,000 people.
When considering forms of modern slavery, the Asia and Pacific region had a high prevalence of forced labour (4.0 per 1,000 people) compared to other regions. The rate of forced marriage was two victims per 1,000 people.
Over half of all victims of forced labour exploitation (55 percent) were held in debt bondage and this affected male victims more than female victims. The Asia and the Pacific region had the highest number of victims across all forms of modern slavery, accounting for 73 percent of victims of forced sexual exploitation, 68 percent of those forced to work by state authorities, 64 percent of those in forced labour exploitation, and 42 percent of all those in forced marriages.
Within the region, North Korea, Afghanistan, and Pakistan were the countries with the highest prevalence of modern slavery. India, China, and Pakistan had the highest absolute number of people living in modern slavery and accounted for 60 percent of the victims in the region.
These regional figures, while important, should be interpreted cautiously given the gaps and limitations of data in key regions and subregions. For example, only one national survey was conducted in East Asia (Mongolia), and it is not possible to survey in areas of countries that are experiencing profound and current conflict, such as within parts of Pakistan. The lack of data from these regions experiencing conflict means that modern slavery estimates for conflict-affected countries are likely to understate the problem.
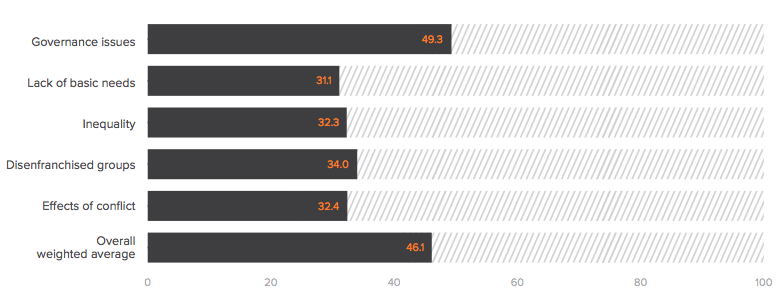
Vulnerability within Asia and the Pacific
Regional average vulnerability scores by dimension, Asia and the Pacific
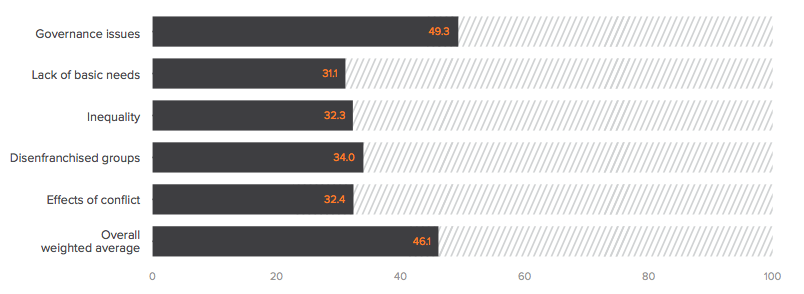
Overall, the Asia and the Pacific region performed relatively well on the conflict dimension of the vulnerability model. Nonetheless, countries with highest prevalence in the region include North Korea, Afghanistan, and Pakistan. North Korea has well documented state-imposed forced labour, and Afghanistan and Pakistan are both impacted by protracted and ongoing conflict. The Asia and the Pacific region scored relatively poorly on the disenfranchised groups dimension, which perhaps reflects discrimination of individuals on the basis of migration status, race, ethnicity, and/or sexual orientation. A key flash point in the region has been the mass displacement, abductions, sexual violence, and murders committed against the Rohingya population from Myanmar. International organisations have already warned of the likelihood of sexual enslavement and human trafficking occurring as a result of this crisis. On overall vulnerability, Afghanistan had the highest levels of vulnerability (94 percent) and New Zealand the lowest (two percent).
Government responses within Asia and the Pacific
Asia and the Pacific scored an average CCC rating on government response. While this is the same overall rating as given to the Arab States (also averaging CCC), Asia and the Pacific has shown a trend toward improving the safety nets that help to prevent modern slavery for specific groups or sectors. For example, recognising that migrant workers from this region can become vulnerable, there have been attempts to strengthen pre-departure and on-arrival protection for domestic and construction workers from South Asia working in the Arab States, including the use of bilateral labour agreements that include protections. Certain sectors, such as the Southeast Asian fishing industry, have also been in the spotlight in recent years, and while the Thai and Indonesian governments in particular have taken steps to respond to the issue, more remains to be done to reduce the endemic abuse that occurs in the fishing industry.
EUROPE AND CENTRAL ASIA
Europe and Central Asia covers 51 countries across the subregions of Central and Western Asia, Eastern Europe and Northern, Southern, and Western Europe. Covering 12.4 percent of the world’s population, within these subregions there is broad variation and diversity in terms of people, culture, history, and levels of development.
3,590,000 - Estimated number of people in modern slavery
9% - Regional proportion of global estimate
91% - Forced labour percentage
9% - Forced marriage percentage
On any given day in 2016, an estimated 3.6 million men, women, and children were living in modern slavery in Europe and Central Asia. This region had a prevalence of 3.9 people in modern slavery for every 1,000 people in the region.
When considering the forms of modern slavery, the rate of forced labour (3.6 per 1,000 people) was higher than the rate of forced marriage (0.4 per 1,000 people). The prevalence of forced marriage was the lowest of all the world’s regions. A little over a third of victims of forced labour exploitation were held in debt bondage (36 percent), with a higher proportion of men trapped through debt.
The region also accounted for 14 percent of forced sexual exploitation worldwide.
Within the region, Turkmenistan, Belarus, and Macedonia are the countries with the highest prevalence of modern slavery, while Russia, Turkey, and Ukraine have the highest absolute number and account for over one-third (39 percent) of the victims in the region.
These regional figures, while important, should be interpreted cautiously given the gaps and limitations of data in key regions. For example, there are numerous reports of forced marriages in Central Asia but few surveys on the issue have been conducted there. This contributes to lower rates of forced marriage than may be the case in this region.
Vulnerability within Europe and Central Asia
Regional average vulnerability scores by dimension, Europe and Central Asia
Countries in Europe and Central Asia scored consistently well on vulnerability measures across all five dimensions, which reflects the generally higher average GDP per capita for this region. Interestingly, Europe and Central Asia performed relatively poorly on the disenfranchised groups dimension of vulnerability, which may reflect increasing anxiety over the refugee and migrant crises (Figure 8). On this dimension, scores ranged from a high of 60 percent in Poland to a low of two percent in Iceland. Overall, the highest vulnerability score across all dimensions was in Turkmenistan (58 percent) and the lowest was in Denmark (one percent).
Government responses within Europe and Central Asia
While there is evident variation at the subregional level, overall the Europe and Central Asia region has the strongest response to modern slavery, scoring an average BB rating. In Europe in particular, governments are generally characterised by high levels of political will and resources. These countries also have multiple regional bodies which hold them to account and monitor their responses. For example, the European Union’s proactive approach to tackling modern slavery means that Europe leads the way in engaging with business as well as taking steps to investigate public procurement.
Generally speaking, governments have improved their responses in recent years by taking more steps to strengthen their legislation, provide protective services for victims, establish coordination and accountability mechanisms, and respond to risk. Countries in Central Asia have also taken steps to tackle state-imposed forced labour in recent years, as shown by a reduction in forced labour in Tajikistan and the willingness of the government of Uzbekistan to engage with the ILO.12 More needs to be done, however, to reduce rates of forced labour in Turkmenistan and Uzbekistan so that their responses prevent mass mobilisation of the population in the annual cotton harvest.
IMAGE CREDIT: ILO
